rleafmap
interactive maps with R and leaflet

interactive maps with R and leaflet
rleafmap is an R package to display spatial data with interactive maps powered by Leaflet. It is designed to be very easy to use and provides the features necessary to generate nice interactive maps with R.
rleafmap key features :
The package rleafmap has been presented during the 3ème Rencontres R meeting in Montpellier (27/6/2014). Slides are available in french and english. You can also download the abstract in french.
rleafmap is still in development. Current version is 0.1 (beta), sources can be downloaded on Github. After downloading the sources, you can install the package with the following command:
install.packages("<PATH_TO_THE_FILE>", repos = NULL, type = "source")
Alternatively, you can install the last version from github using the devtools package:
devtools::install_github("fkeck/rleafmap")
library(rleafmap)
data(velov)

stamen.bm <- basemap("stamen.toner")
velov.sta <- spLayer(velov, stroke = F, popup = velov$stations.name)

writeMap(stamen.bm, velov.sta, width = 550, height = 250,
         setView = c(45.76, 4.85), setZoom = 12)
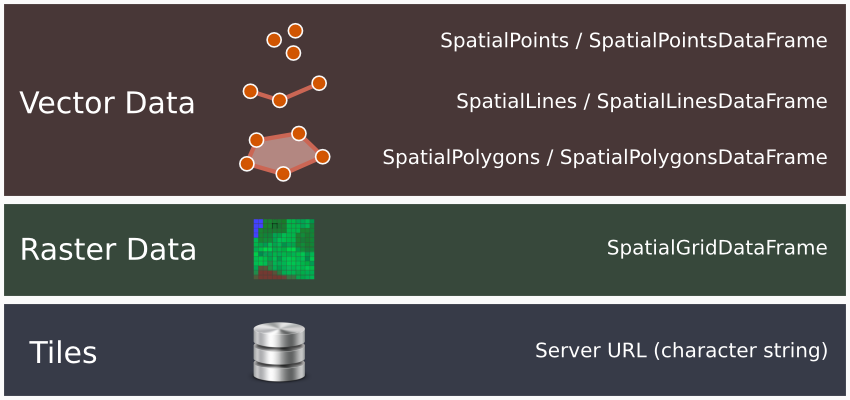
You can add three kinds of data to your maps: tiles layers, vector data and grid data.
Tiles layers just consist in a character string giving the URL of the server. For the data the package use exclusively objects inheriting from the Spatial class of the sp package. These classes are central and allows to work with many packages. If you don't know it, a good place to start is the vignette of the sp package on CRAN. If you prefer a good book have look to Bivand et al. (2013) Applied Spatial Data Analysis with R.
⚠ rleafmap works only with data in WGS84 system (EPSG:4326). If you have a different coordinate reference system, you can use the function spTransform of the sp package.
The use of the package is simple and tries to imitate traditionnal GIS systems. The workflow is as follow:
We will start with a very simple map with only one tile layer. Tiles layers are dynamically downloaded by Leaflet when the user explores the map. Basically you just have to provide the server URL from which tiles will be downloaded. URL should have the form 'http://{s}.somedomain.com/somepath/{z}/{x}/{y}.png' with {s} a facultative subdomain, {z} the zoom level and {x}, {y} the coordinates.
However, if you want things done quickly, rleafmap comes with a list of pre-configured servers. Names of these servers are returned by the function bmSource().
#Loading the package
library(rleafmap)

#Creating a tile layer object
mapquest.bm <- basemap("mapquest.map")

#Generating the map
writeMap(mapquest.bm, width=550, height=250,
         setView=c(45.76, 4.85), setZoom=12)
You can see that we don't provide an URL but just the name of a ready-to-use server (mapquest.map).
The function writeMap is a bit special, you can provide as many layers as you want, they just must be added before the other arguments (used to set up the size of the map, the initial view and many other things; check the help).
To create a layer of data we need to use the function spLayer. This is a generic function, which means that you can provide different kind of data (points, lines, polygons, grid), the function will find a way to deal with.
When you create a data layer you set how data will be displayed.
# Loading the package
library(rleafmap)

# Creating a tile layer object
stamen.bm <- basemap("stamen.toner")

# Loading data
data(velov)

# Creating a data layer object (points)
velov.map <- spLayer(velov, stroke = FALSE,
                     fill.col= c("red", "green"),
                     popup = velov$NAME)

#Generating the map
writeMap(stamen.bm, velov.map, width = 550, height = 250,
         setView = c(45.76, 4.85), setZoom = 12)
In this example, we colorize the points in red and green. It is important to understand that most of the arguments of spLayer are recycled to fit to the size of your data. However, you will generally provide vectors of size 1 like stroke in this example or vectors exactly fitting your data like for the popup. The popup argument allows to print pop-ups when users click on features.
Sometimes, you export maps with several layers. In this case it can be hard for the user to visualize the information he is looking for. Layers control is an interesting feature of Leaflet which allows the user to select which layers are displayed on the map.
To add a layer selector to a map with rleafmap you just need to customize the user interface. The user interface is an object which can be easily created with the function ui(). You can also use it to manage the position and visibility of interface elements like zoom buttons, credits...
In the following example we will compute a new layer, the density of stations, using the spatstat package. then we will create a map with two tiles layers, the locations of the stations and their density. We will add a control button to manage these layers.
# Loading the packages
library(rleafmap)
library(spatstat)
library(maptools)

# Loading data
data(velov)

# Computing a grid of station density
win <- owin(xrange = bbox(velov)[1,] + c(-0.01,0.01),
            yrange = bbox(velov)[2,] + c(-0.01,0.01))
velov.ppp <- ppp(coordinates(velov)[,1], coordinates(velov)[,2],
                 window = win)
velov.ppp.d <- density(velov.ppp, sigma = 0.005)
velov.d <- as.SpatialGridDataFrame.im(velov.ppp.d)
velov.d$v[velov.d$v < 10^3] <- NA

# Creating two tile layer objects
stamen.bm <- basemap("stamen.toner")
mapquest.bm <- basemap("mapquest.map")

# Creating two data layer objects (stations and density grid)
velov.sta <- spLayer(velov, stroke = FALSE, fill.col = 1,
                     size = 3, popup = velov$NAME)
velov.den <- spLayer(velov.d, layer = "v",
                     cells.alpha = seq(0.1, 0.8, length.out = 12))

# Creating an UI object with a layer control
my.ui <- ui(layers = "topright")

#Generating the map
writeMap(stamen.bm, mapquest.bm, velov.sta, velov.den,
         width = 550, height = 250, interface = my.ui,
         setView = c(45.76, 4.85), setZoom = 12)
Popups are a very attractive way to attach additional informations to your data. They can be added to any vector data (points, lines and polygons) by using the popup argument in the spLayer function. Moreover, since Leaflet supports HTML popups you can control precisely the formatting.
The following example shows how to extend popups with HTML tags with a dataset of the distribution of camp sites in France.
library(rleafmap)
data(campsites)

gcol <- rev(heat.colors(5))
gcut <- cut(campsites$N.CAMPSITES, breaks = c(-1, 20, 40, 60, 80, 1000))
region.col <- gcol[as.numeric(gcut)]

pop <- paste(campsites$DEP.NAME, " (", campsites$DEP.CODE, ") <br>",
             campsites$N.1, "★ <br>", campsites$N.2, "★★ <br>",
             campsites$N.3, "★★★ <br>", campsites$N.4, "★★★★ <br>",
             campsites$N.5, "★★★★★", sep = "")

mapquest.bm <- basemap("mapquest.map")
cs.lay <- spLayer(campsites, fill.col = region.col, popup = pop)

my.ui <- ui(attrib.text = "Campsites Data: <a href='http://www.ign.fr/'>IGN</a>, <a href='http://atout-france.fr/'>ATOUT France</a>")

writeMap(mapquest.bm, cs.lay, width = 550, height = 350,
         interface = my.ui, setView = c(46.5, 3), setZoom = 5)